
Entropy: The opposite of chaos
Originally published on divergentblue.com in 2013, restored from backup. Some links to other sites may no longer work.
What disorder looks like
Which image below looks more disorderly? Which seems more chaotic?
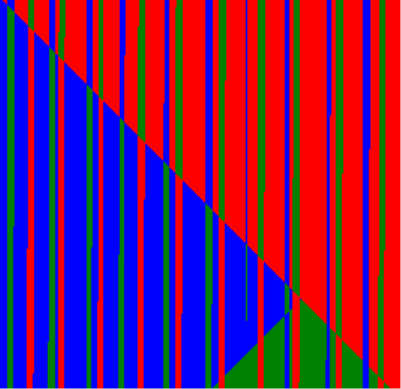
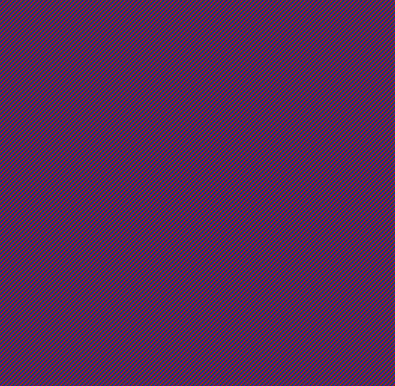
Perhaps these seems like trick questions - they’re not. They may seem like leading questions - they most certainly are. Feel free to answer with your gut on this. (Hint: That image on the right looks fairly orderly to me)
Entropy
Entropy is commonly referred to with the terms disorder, randomness, and chaos. In fact, many textbooks use the term disorder explicitly to introduce the concept, however, this description tends to lead to all sorts of popularized misunderstandings of the concept.
Entropy is a real, measurable quantity, just like volume, energy, or momentum. So what does it measure? I propose it’s best to understand it not as a measure of disorder, but as a measure of uniformity in a system.
Credit goes here to Dr. Leno Pedrotti at the University of Dayton, who first introduced me to this idea.
To understand this, let me create out of nothing a very unscientific term called ‘clustering’ of energy. I’m certainly not going to worry about defining it precisely - just consider this qualitative description instead:
Systems with a large amount of clustered, usable energy have very low entropy (think dry baking soda and vinegar in separate containers), but as a closed system evolves over time, that usable energy dissipates into useless (unclustered) heat (think about the uniform mixture of baking soda and vinegar long after the ‘explosion’).
Quantifying entropy
Now it’s time to do one of my favorite things - stretching an analogy to the point of nearly breaking, and then breaking it. Let’s focus on this make believe idea of clustering for a moment in hopes of gaining some insight into how entropy works.
It won’t be immediately clear why I’m doing this, and that’s ok, but consider a very simple system of six balls, two of each of the colors red, blue, and green. Furthermore, let’s suppose we can distinguish between balls of the same color, perhaps because one of them has a black dot on it. The balls might look something like this:
Supposing that I randomly order the balls in a straight line, I’d like to know exactly how many ‘clusters’ of balls of the same color I can expect to get, on average. To find out, we just have to count up all the possible configurations and weight them accordingly.
There could be up to three clusters in a configuration. That is, the two reds, two blues, and two greens are each together. The first cluster could be any of the three colors, the second could be any of the remaining two, and the third must be the remaining colors. That’s 3 * 2 * 1 = 6 ways. Furthermore, each cluster could be formed in two ways - remember that balls of the same color are distinguishable. That means there are 2 * 2 * 2 = 8 ways to rearrange each of the 6 configurations, totaling 6 * 8 = 48 possible three-cluster configurations.
Let’s now consider the case of two clusters. The non-clustered balls could be at the ends, or sit at positions 3 and 6, or positions 1 and 4 (see below). For each of these cases, the colors could again be distributed in 6 ways, and the same-colored balls rearranged in 8 ways, yielding 3 * 6 * 8 = 144 two-cluster configurations.
Next, consider the one-cluster option. This one’s slightly tricky because of the positioning, as you’ll see. First, the cluster could be at the far left. Next it could occupy positions 2 and 3. Good so far? Now, when it occupies positions 3 and 4, we can actually distribute the other balls in two patterns (A, B, cluster, B, A) or (A, B, cluster, A, B). Finally, the cluster could be positioned at 4 and 5, or 5 and 6. That’s six total cases, again, multiplied by 6 color configurations and 8 rearrangements, to get 6 * 6 * 8 = 288 total configurations.
Finally, we’ve found 48 + 144 + 288 = 480 configurations so far, but there are a total of 6! = 720, leaving 720 - 480 = 240 possible zero-cluster configurations.
So, on average, we have 3*(48/720) + 2*(144/720) + 1*(288/720) + 0 = 1 cluster.
I thought we were talking entropy
Absolutely, so let’s get back to it. If we think about the clusters as usable energy (this is the stretchy part of the analogy), we can see that the fewer clusters, the higher the entropy. The interesting thing about the calculation above is that no matter how the balls are initially configured, if they are free to randomly distribute themselves without any constraint, they are likely to settle into a fairly low-clustered (high entropy) state. Now, think about what would happen if we had even more balls, and even more colors, and eve more dimensions. All of these things would further reduce the amount of clustering.
This is exactly what happens at the particle level in thermodynamics. Given that all states are equally likely, since there are many many more states with lower energy levels, particles tend to organize themselves in such a way that the usable energy lessens, and thus the entropy rises over time. We might not expect this, we might not even like it, but that’s really what happens. Particles do assort themselves randomly as if they were selected from a powerball machine, and it just so happens that there are enough configurations with a low-energy state, that they are way more likely to occur, so much so that we never ever ever observe entropy decreasing.
What about the pictures?
Here is why I prefer the term uniformity to disorder when describing entropy.
Look again at the pictures at the top of this post. See how the one on the left exhibits much more clustering than the one on the right? Also, remember how you answered the question: “which one looks more disorderly?”. The left image, which is more disorderly (the more highly clustered), actually represents the lower entropy state. The image on the right, the one which is the most uniform, represents the higher-entropy scenario.
So it is in thermodynamics. The more uniformly distributed the energy, the higher the entropy, and despite the textbook definitions, chaos and disorder are really the opposite of entropy.
Closing Thoughts
Two final notes:
First, for those curious, here is the C# code used to generate the two images. The first is a randomly generated image with some ‘clustering’ constraints. The second is simply the mundane repetition of red, green, and blue pixels in sequential order - as uniform as it gets.
Finally, one interesting property of entropy is that it always increases. Because of this, all closed systems eventually lose any ability to transfer energy. You may have heard of the ‘heat death’ of the universe. That’s really what the image on the right represents. It’s the state of highest possible entropy, when all the usable energy has been, well, used, and it is the predicted end state of the assumption that entropy always increases. If you really believe in it, and that the universe is a closed system, then everything we ever do will eventually end with a uniformly distributed universe where nothing interesting will ever happen again. Fun!